DATA ANALYTICS
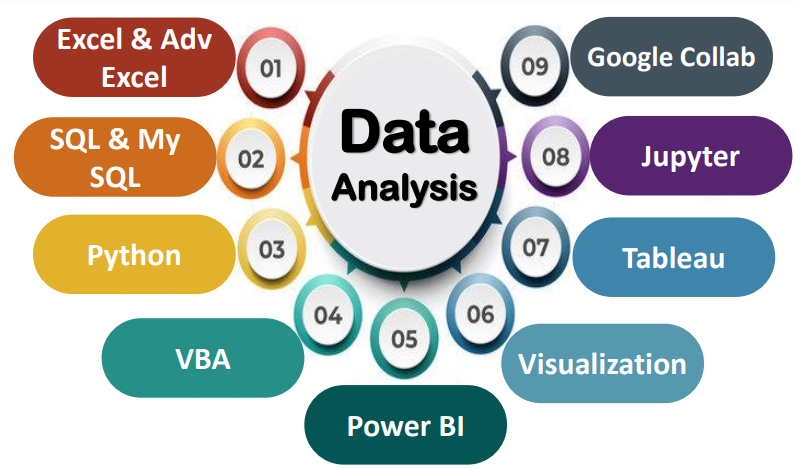
Data Analytics
Data analytics is the process of analyzing raw
data to uncover meaningful insights and patterns
that can inform decision-making. By leveraging
techniques such as statistical analysis, machine
learning, and data visualization, organizations can
extract valuable information from large datasets
to drive strategic initiatives, optimize operations,
and gain a competitive edge in today’s datadriven world
Top Computer Training Courses in Delhi
Computer Courses
Java & Python
Data Science
Android Development
Full Stack Development
Our Main Achievements
Empowering the Next Generation of Tech Leaders – Our Students are Making a Difference!
+ TEACHERS
+ CLASSES COMPLETE
STUDENTS ENROLLED
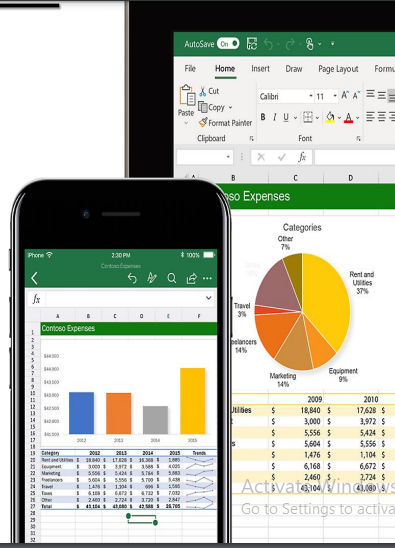
Excel & Advance Excel
- Basic Functions
- Data Organization
- Formatting
- Charts and Graphs
- PivotTables
- Advanced Functions
- Data Analysis Tools
- Macros and Automation
- Data Visualization
- Power Query and Power Pivot
VBA
- Integration with Office Suite
- Object-Oriented Language
- Event-Driven Programming
- Macro Recorder
- IDE (Integrated Development Environment)
- Access to Object Model
- Language Constructs
- Extensibility & Security
- Community and Resources
SQL & MYSQL
- Standardized Language
- Data Definition Language (DDL)
- Data Manipulation Language (DML)
- Data Control Language (DCL)
- Data Query LaCage (DQL)
- Data Types
- Constraints & Transactions
- Open Source RDBMS
- Compatibility
- Client/Server Architecture
- Scalability
- Performance
- Community and Support
- Storage Engines & Administration Tools
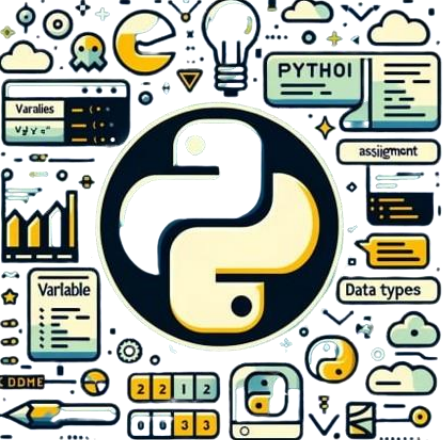
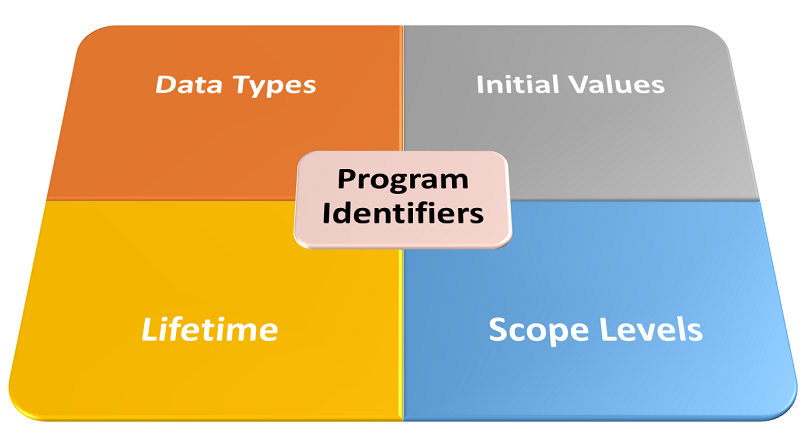
PYTHON
- General-Purpose Programming Language
- Readability and Simplicity
- Interpreted Language
- Dynamic Typing
- Object-Oriented
- Extensive Standard Library
- Large Ecosystem
- Platform Independence
- Community and Support
- Open Source
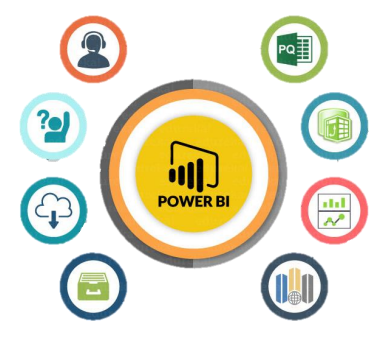
POWER BI
- Data Visualization
- Data Connectivity
- Data Modelling
- Data Analysis
- Data Visualization Customization
- Interactive Dashboards
- Sharing and Collaboration
- Security and Governance
- Mobile Apps
- Integration with Other Microsoft Products
VISUALIZATION
- Communication
- Understanding Patterns and Trends
- Exploration and Discovery
- Decision Making
- Storytelling
- Visualization Types
- Design Principles
- Tools and Technologies
- Interactivity
- Ethical Considerations
TEABLEAU
- Visual Analytics
- Ease of Use
- Connectivity
- Data Preparation
- Powerful Visualizations
- Interactivity
- Dashboards and Stories
- Sharing and Collaboration
- Advanced Analytics
- Scalability and Performance
JUPYTER NOTEBOOK
- Interactive Code Execution
- Support for Multiple Languages
- Markdown Integration
- Rich and Interactive Outputs
- Code Sharing and Collaboration
- Extensibility
- Extensions and Widgets
- Data Visualization Capabilities
- Live Code Execution
- Debugging
- Centralized Deployment
GOOGLE COLAB
- Jupyter Notebooks
- Free Cloud Computing
- Integration with Google Drive
- Support for Libraries
- Collaborative Editing
- Code Snippets and Examples
- Markdown Support
- Export Options